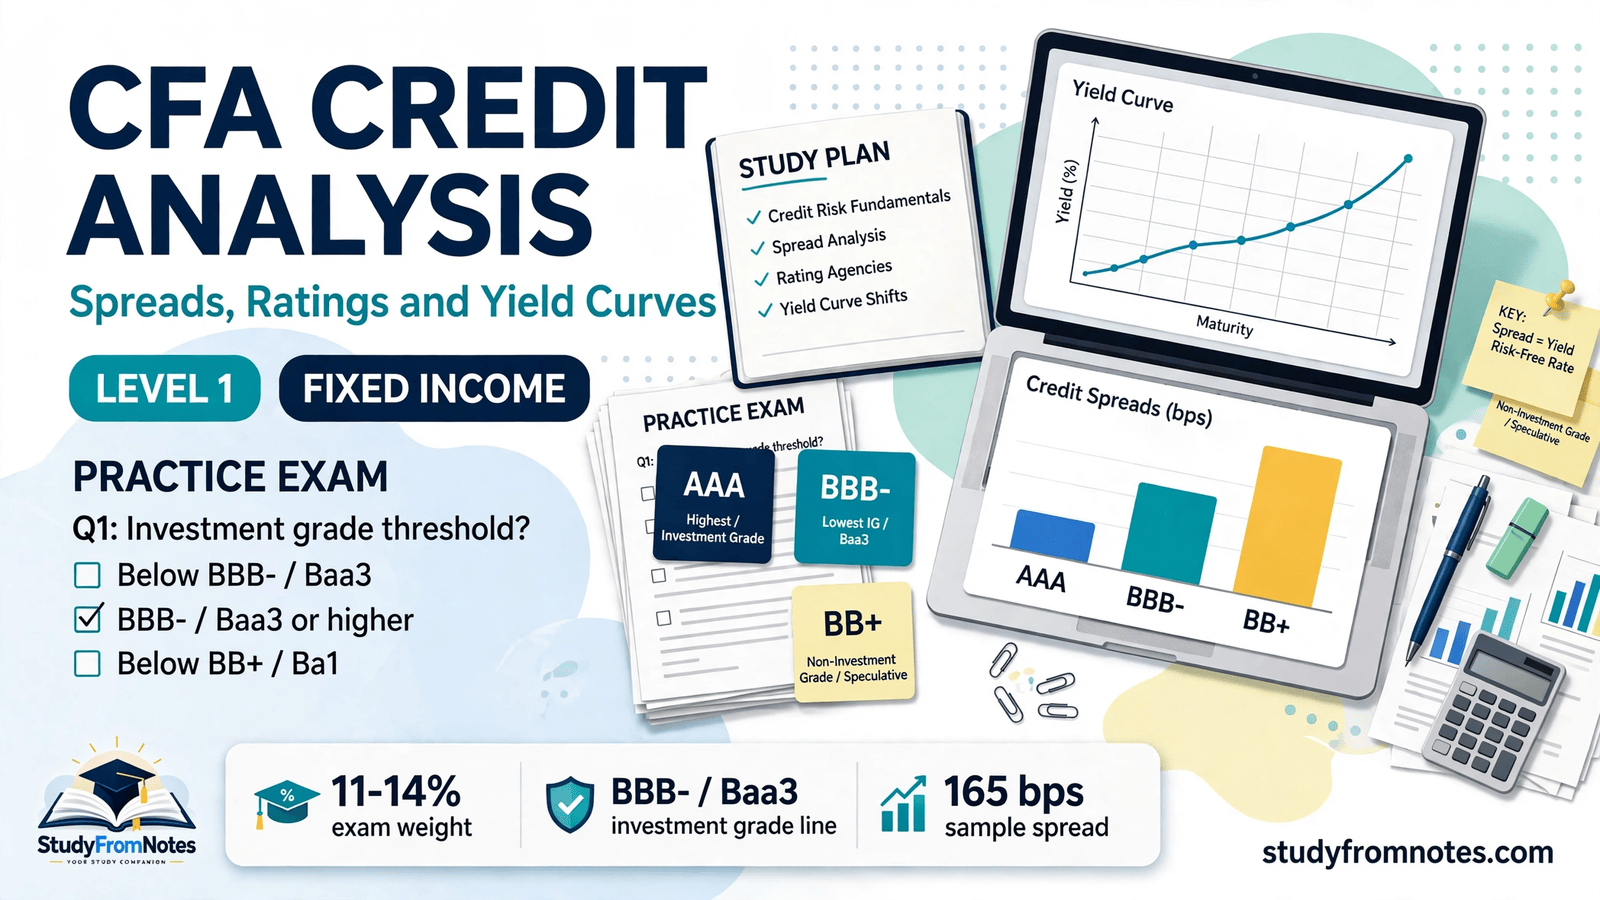
CFA credit analysis is the study of whether a borrower will repay its debt on time and in full, and what happens to a bond price when that judgment changes. This note covers the four blocks the exam tests after bond valuation: credit ratings, credit spreads in basis points, yield curves, and securitization. Fixed Income carries an 11 to 14 percent weight in the 2026 CFA Level 1 exam, about 20 to 25 of the 180 questions, tested in Session 2, the same weight from February 2027. Start from the CFA notes hub.
CFA credit analysis: what it is and why spreads move
CFA credit analysis judges whether a borrower can and will repay its debt. Ratings sort issuers from AAA to default, spreads price the extra yield over government bonds, yield curves show how rates change with maturity, and securitization slices loan pools into tranches that absorb losses in order.
Credit risk has three parts. Default risk is a missed payment. Credit migration risk is the chance of a rating cut, and credit spread risk is the chance the spread widens; both push the price down with no missed payment. Credit analysis asks two questions: can the issuer pay, and will it pay. Capacity is tested with numbers, such as cash flow and leverage. Willingness is tested with judgment: management quality and governance. For corporate issuers the four Cs are character, capacity, collateral, and covenants. For government issuers the test is economic strength and the fiscal position.
CFA credit analysis and the rating scales
Three agencies dominate: S and P Global Ratings, Moody’s, and Fitch Ratings. S and P and Fitch share a letter scale with plus and minus notches; Moody’s uses numbers, where 1 is strongest. A rating is an opinion, not a guarantee.
| Quality | S and P / Fitch | Moody’s |
|---|---|---|
| Highest | AAA | Aaa |
| High | AA+, AA, AA- | Aa1, Aa2, Aa3 |
| Upper medium | A+, A, A- | A1, A2, A3 |
| Lower medium | BBB+, BBB, BBB- | Baa1, Baa2, Baa3 |
| Speculative | BB+, BB, BB- | Ba1, Ba2, Ba3 |
| Highly speculative | B+, B, B- | B1, B2, B3 |
| Near default | CCC and below, D | Caa and below, C |
The line that matters sits between BBB- and BB+ (S and P and Fitch) and between Baa3 and Ba1 (Moody’s). BBB- and Baa3 are the lowest investment grade ratings. One notch lower, BB+ or Ba1, is the highest high yield rating, also called speculative grade or junk.
That notch carries real money: many funds may hold investment grade bonds only, so a downgrade forces selling. An issuer cut to high yield is a fallen angel; one upgraded the other way is a rising star. The default gap is large: S and P’s 2024 study gives average one-year default rates of 0.08 percent investment grade and 3.54 percent speculative grade (1981-2024).
CFA credit analysis: credit spreads in basis points
A credit spread is the extra yield a corporate bond pays over a government bond of the same maturity: the market price of credit risk, quoted in basis points, where one basis point equals 0.01 percent. Spreads widen when credit quality falls or liquidity dries up, and narrow when conditions improve.
Level 1 tests four spread measures. The G-spread is the spread over a government bond yield; the I-spread is the spread over the swap rate. The Z-spread is the constant spread added to each spot rate on the government spot curve so the bond price matches its market price. The option-adjusted spread, or OAS, is the Z-spread minus the value of any embedded option: the right measure for callable or putable bonds.
Worked example 1: from yields to a spread in basis points
A 10-year government bond yields 4.20 percent, Harbor Industries 5.85 percent, a BBB rated bond 6.40 percent, and a AAA rated bond 4.90 percent. All four have the same maturity.
| Bond | Yield | Spread over government bond |
|---|---|---|
| 10-year government bond | 4.20% | 0 basis points |
| Harbor Industries corporate bond | 5.85% | 165 basis points |
| BBB rated corporate bond | 6.40% | 220 basis points |
| AAA rated corporate bond | 4.90% | 70 basis points |
Harbor: 5.85 minus 4.20 is 1.65 percent, or 165 basis points. BBB: 6.40 minus 4.20 is 2.20 percent, or 220 basis points. AAA: 4.90 minus 4.20 is 0.70 percent, or 70 basis points. BBB minus AAA is 150 basis points: the market charges 1.50 percent a year for BBB over AAA. On 10 million dollars, the Harbor spread is worth 165,000 dollars a year.
CFA credit analysis and the yield curve
A yield curve plots the yields of bonds with the same credit quality against their maturities: the term structure of interest rates. Its shape shows market expectations for growth, inflation, and policy rates.
| Shape | Pattern | Usual reading |
|---|---|---|
| Normal | Long yields above short yields | Growth expected to continue |
| Steep | Long yields far above short | Stronger growth expected |
| Flat | Short and long yields close | Uncertainty |
| Inverted | Short yields above long yields | Tight policy; lower rates expected |
| Humped | Middle maturities yield most | Rates high, then falling |
Four theories explain the shape. Pure expectations theory says the long rate averages expected future short rates. Liquidity preference theory adds a term premium for holding long bonds. Market segmentation theory says each maturity is its own market. Preferred habitat theory says investors will move from a preferred maturity if the extra yield compensates them.
The forward rate ties the curve together. With a 1-year spot rate of 3.00 percent and a 2-year spot rate of 4.00 percent, the implied 1-year rate one year from now is 1.04 squared divided by 1.03, minus 1. That is 1.0816 divided by 1.03, which is 1.0501, minus 1, giving 5.01 percent, higher than either spot rate.
CFA credit analysis: securitization and the waterfall
Securitization turns illiquid loans into tradeable securities. The originator, usually a bank, pools similar loans such as mortgages, auto loans, or credit card receivables, and sells the pool to a special purpose vehicle, or SPV. The SPV is bankruptcy remote, so the assets are protected if the originator fails.
The SPV slices the pool into tranches. Senior is paid first, carries the lowest risk, and pays the lowest yield. Mezzanine sits in the middle. Equity is paid last, carries the highest risk, and offers the highest potential return. Cash flows run down the waterfall in order of seniority, while losses run up from the bottom: equity absorbs losses first, then mezzanine, and senior only after the juniors are wiped out. Credit enhancement protects the senior tranches. Main products: asset-backed securities, mortgage-backed securities, and collateralized debt obligations.
Worked example 2: expected loss and a tranche waterfall
Expected loss equals probability of default times loss given default times exposure at default. Take a 2 million dollar loan: 3 percent probability of default, 45 percent loss given default. Expected loss is 0.03 times 0.45 times 2,000,000, which is 27,000 dollars, or 1.35 percent of the exposure. It is an average over many outcomes, not the loss on any single loan, and it says nothing about unexpected loss, which capital must cover.
Now apply the waterfall to a 100 million dollar pool: senior 75 million, mezzanine 15 million, equity 10 million dollars. Suppose defaults cause 12 million dollars of losses. Equity absorbs the first 10 million dollars and is wiped out. Mezzanine absorbs the remaining 2 million dollars, falling from 15 million to 13 million dollars. Senior loses nothing. That order is the whole lesson.
Covered bonds differ sharply: a covered bond stays on the issuer’s balance sheet and gives dual recourse, a claim on the issuer and a claim on the cover pool, while a securitization sells the loans to an SPV and gives recourse to the pool only. Covered bonds raise funding at a lower cost than unsecured debt, while securitization frees capital and expands lending capacity.
CFA credit analysis exam traps
- BBB- is investment grade, BB+ is not. One notch flips the label.
- A wider spread means a lower price. When the spread rises, the price falls.
- Use the OAS for bonds with embedded options: the Z-spread mixes credit risk with option value.
- An inverted curve is a signal, not a timetable: it does not date a slowdown.
- Senior does not mean risk free: it takes losses once the juniors are exhausted.
- Expected loss needs all three inputs. High PD with small LGD can mean small expected loss.
CFA credit analysis one-page revision box
| Topic | Remember this |
|---|---|
| Weight | Fixed Income 11-14%, 20-25 of 180, Session 2 |
| Credit risk | Default, migration, spread risk; four Cs |
| Investment grade line | BBB- / Baa3 lowest IG; BB+ / Ba1 highest HY; defaults 0.08% vs 3.54% |
| Spreads | Corporate minus government yield; 1 bp = 0.01%; OAS strips out option cost |
| Worked example 1 | 165 bps; BBB 220 bps; AAA 70 bps; BBB – AAA = 150 bps |
| Yield curve | Normal up, inverted down, flat close, humped middle high |
| Securitization | Pool to SPV to tranches; cash senior first, losses equity first |
| Expected loss | EL = PD x LGD x EAD; 0.03 x 0.45 x 2m = 27,000 dollars |
Work the two examples again from memory, then test yourself on the traps. Credit analysis rewards candidates who connect the rating, the spread, the curve, and the tranche structure. For the valuation math behind these yields, see our CFA fixed income bond valuation notes, and return to the CFA notes hub for the other Level 1 topics.

Daniel Mercer is a finance professional writing on professional exams, study strategies, and finance careers.



Leave a Reply